
Markets Brief
Are markets due for a correction?

In financial markets, investors are constantly fighting their last battle. A common behavioral tendency called “Recency Bias,” where investors overvalue recent events, can be challenging to avoid. It’s also proven that investors tend to experience more emotions from losses than gains. For anyone investing in the 21st century, two common beliefs since the Global Financial Crisis of 2008-2009 have been that we’re either going to experience another real estate crisis or a prolonged stock market crisis. Neither has occurred since the GFC. Predicting events like the GFC or the technology crisis of the early 2000s is a fool’s errand. Investors are better off setting asset allocations, investing regularly in a diversified mix of financial assets, riding out market ups and downs, and spending time with family and friends.
However, it’s my job to manage portfolios, so I don’t get that luxury. Yes, I practice the same strategies with myself and with clients. But I am also tasked with paying attention to financial markets and looking for value opportunities. Markets never move up in a straight line. While I am optimistic about markets in the intermediate and long-term horizons, many markets are looking somewhat “frothy” at the moment. Let’s look at a handful of indicators suggesting the market might be due for a correction.
Concentration in Stocks
The performance of the S&P 500 has been driven mainly by a handful of stocks known as the “Magnificent 7.” These companies are Microsoft, NVIDIA, Apple, Amazon, Google, Meta, and Tesla. Their weight in the S&P 500 is 34% and the share of net income is 27% (see Figure 1). These are all incredibly profitable and high-quality companies. However, a high concentration of companies makes the market fragile and susceptible to rapid downside moves if the leading stocks falter. The rise of passive investing has also aided and encouraged concentration in stocks.
Figure 1: Magnificent 7 Stocks
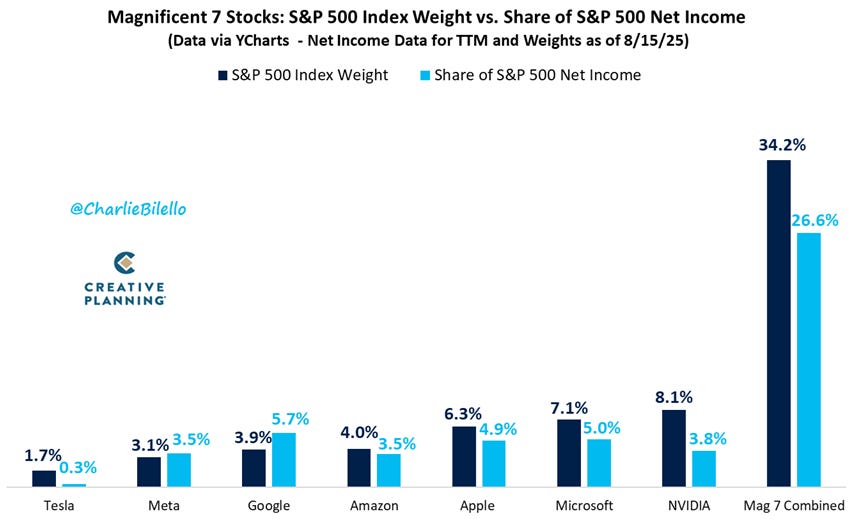
Source: @charliebilello via X
Stock and Bond Volatility Measures
Two measures of volatility are at extremely low levels, suggesting a lack of worry about risk and complacency. The CBOE Volatility Index (VIX) for stocks is hovering around 15, which is below both its 50-day and 200-day moving averages. The VIX spiked to 60 in April of this year. This low volatility is one indication of why many markets have reached or exceeded their all-time highs.
For bonds, the MOVE index is important to watch. The MOVE index is around 80 right now. Reading levels above 125 to 150 start to impact the markets negatively. The MOVE index spiked to around 150 in April of this year.
Figure 2: S&P 500 Volatility Index (VIX)
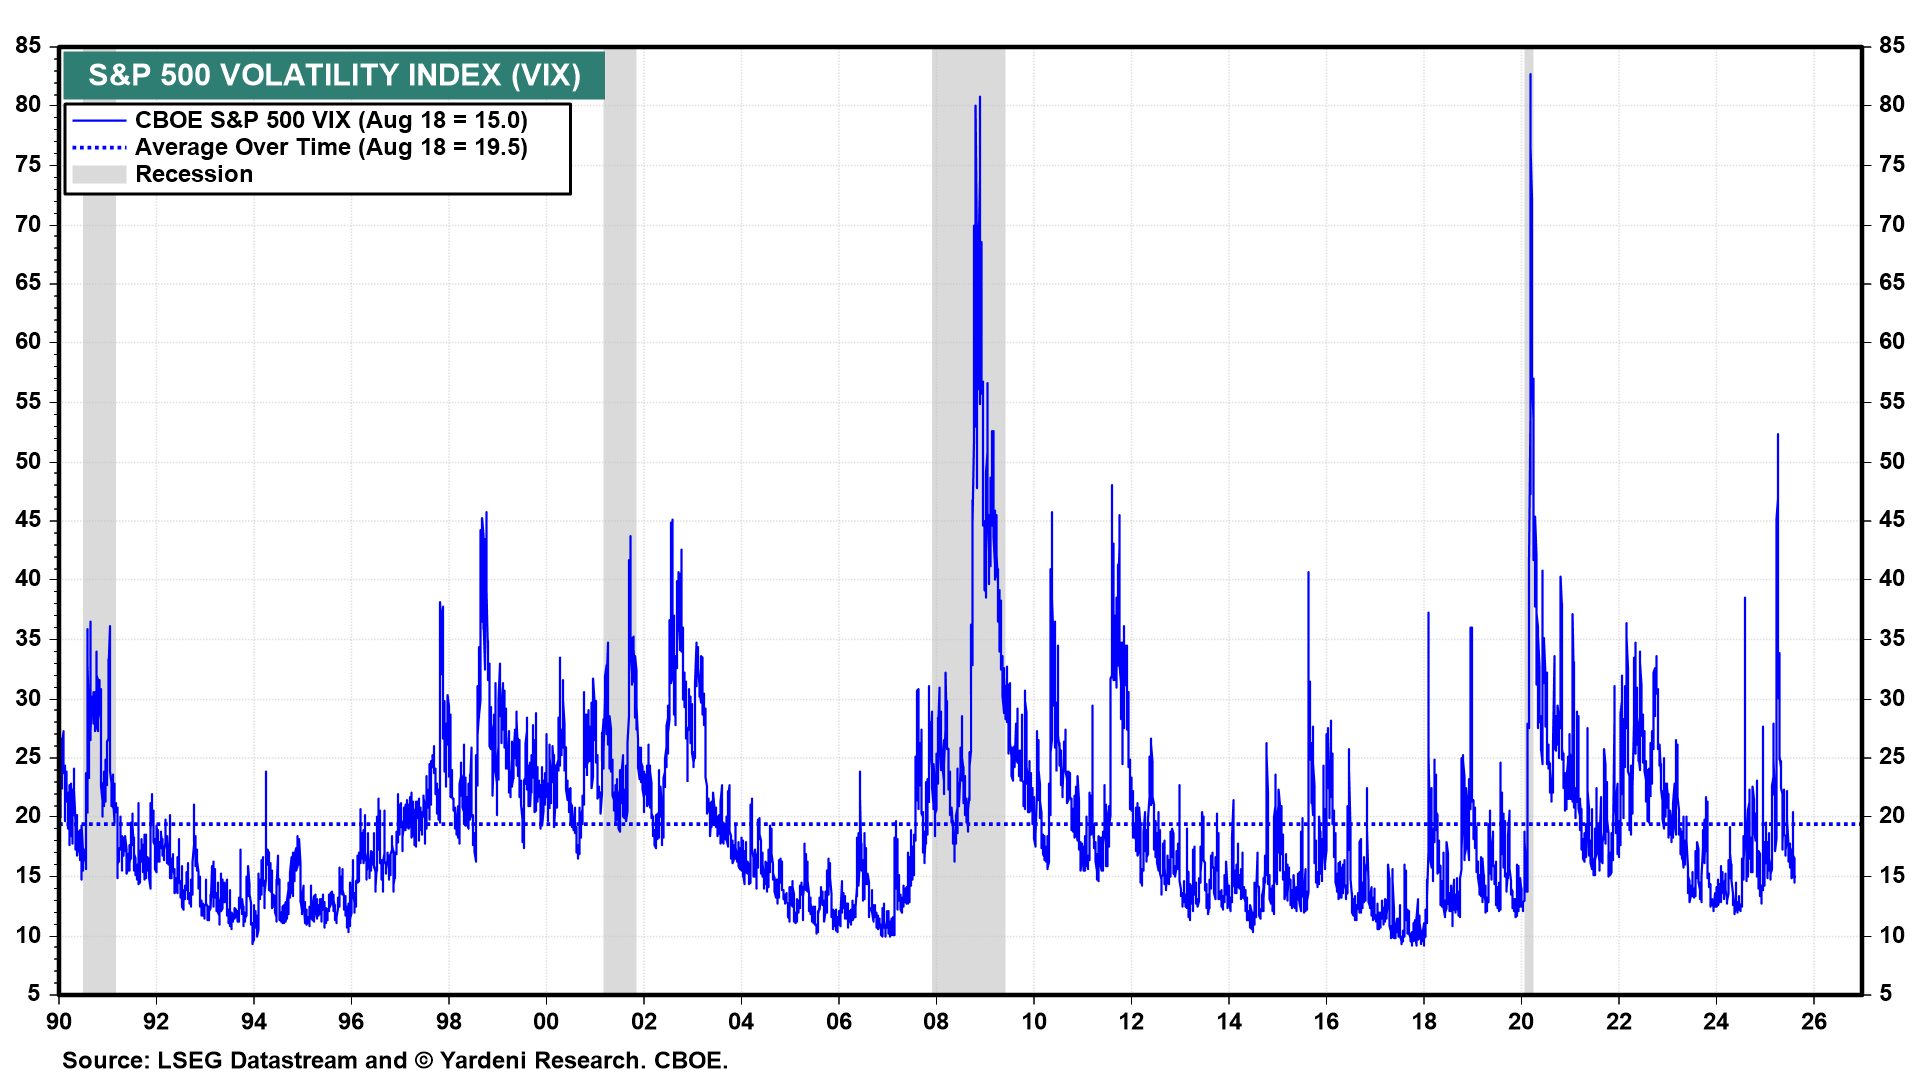
Source: Yardeni Research
Corporate Bond Credit Spreads
Corporate bond spreads are very “tight,” meaning the interest rate paid to purchase debt issued by a corporation, either high quality or high yield (“junk”), has trended closer to the interest rate you would pay for an equivalent government bond. The closer these converge, markets tend to view this as a signal of economic strength, but it also signals complacency. As seen in Figure 3, these spreads tend to “blow out” and rise in times of credit crises and crunches. See the spikes in 2008 and 2020.
Figure 3: Credit Spreads
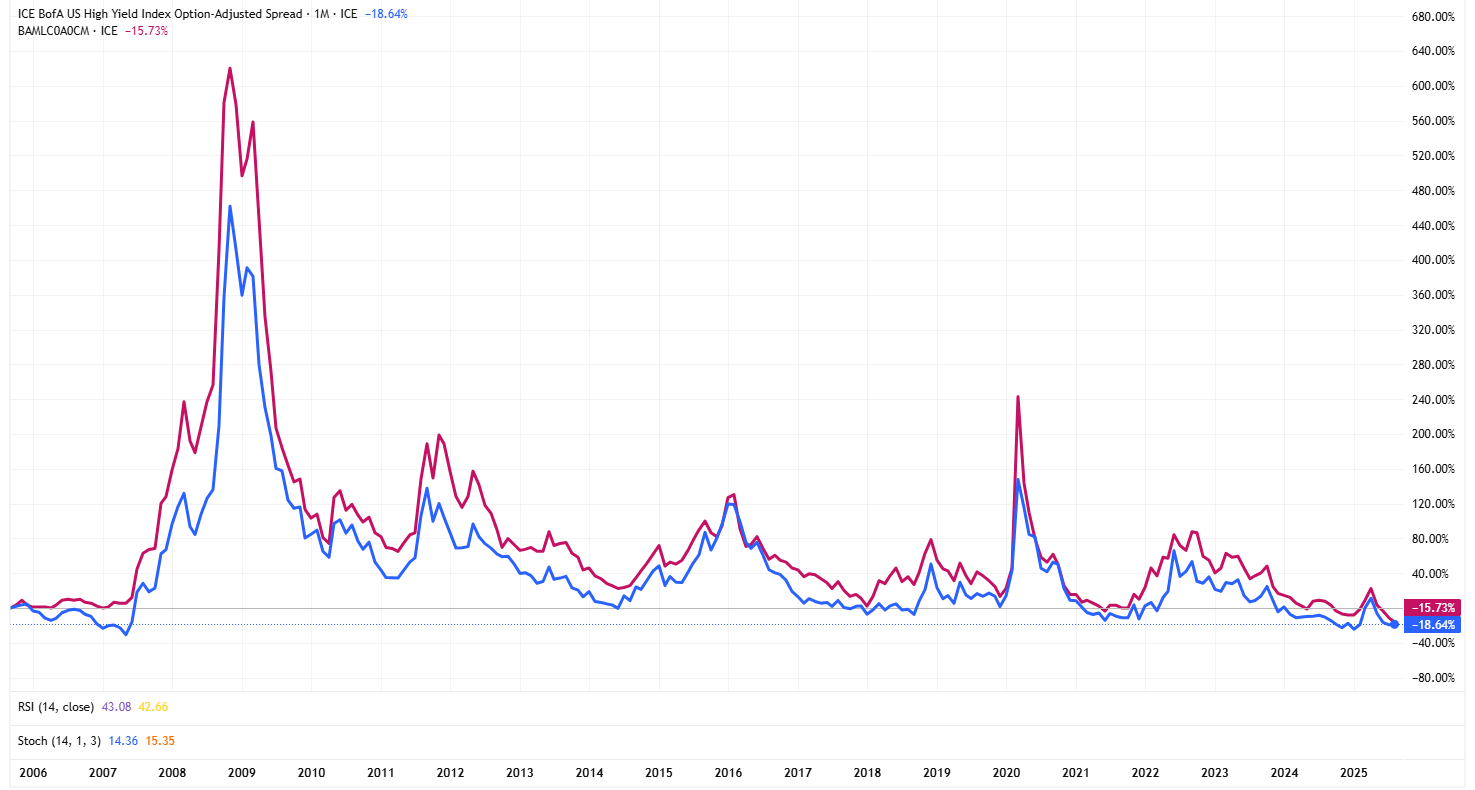
Source: TradingView
Liquidity Indicators & Interest Rates
According to Michael Howell, the global liquidity cycle, which has driven asset markets, is projected to peak around late 2025 or early 2026. The exact timing is always tricky, but a significant drop in the growth rate of liquidity, rather than an absolute fall, can be enough to shake investors.
The slated rebuild of the Treasury General Account (TGA) could drain around $500 billion from US money markets, potentially draining liquidity from markets. Additionally, the depletion of the Reverse Repo Facility (RRP) also presents a meaningful liquidity drain.
Global bond yields have risen on longer-term bonds (30-year) in major developed economies, including Germany, the UK, Japan, and the United States. Central banks have control over short-term interest rates, but not long-term rates. As these governments have high and rising debt, higher interest rates mean higher interest costs and higher budget deficits.
Expectations in the United States surrounding short-term interest rate cuts have increased recently. If the Federal Reserve does not cut rates as expected, this could cause a short-term correction.
We’re just starting to see the adverse effects of tariffs, which act as a tax on consumption. The data surrounding tariffs is incredibly complex, but this is another issue to watch.
Momentum and Trading Indicators
Some indicators of momentum in specific indices and individual stocks suggest that, despite prices moving higher, momentum is slowing and rolling over. This indicates that prices may follow momentum in a downward direction. The “put/call” ratio is low, suggesting that short-term traders are in a very bullish position. Some trend following strategies are incredibly “long,” indicating extended positioning.
Conclusion
Any one of these indicators on its own would not be a huge deal. However, when many are flashing at the same time, it should at least give investors pause. Of course, readers know that I preach long-term, strategic asset allocation is the best route to take over tactical, active approaches. However, I like to be aware of and follow many short-term signals in the market. This certainly does not require investors to take actions such as selling or shorting markets. Instead, understanding short-term market indicators and sentiment can help investors emotionally stomach drops in markets, which inevitably occur. For long-term investors, spotting opportunities for adding fresh capital in times of stress or rebalancing during downturns becomes key to long-term growth and preservation.
Market Returns
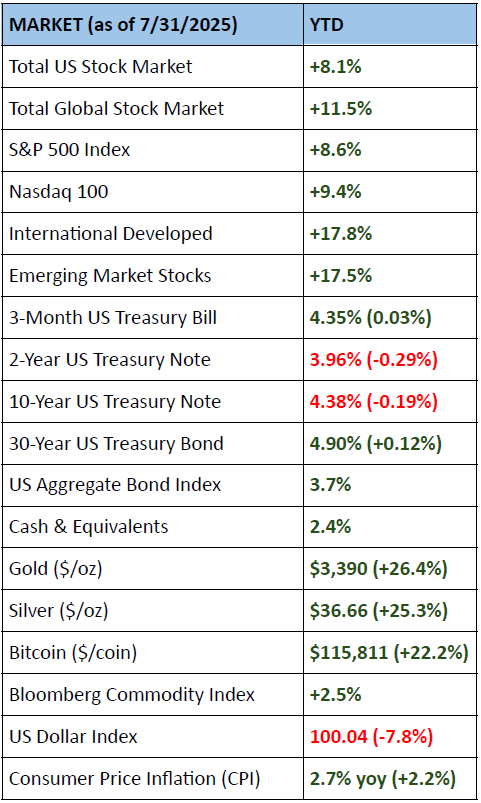
Sources: Kwanti Portfolio Analytics, TradingView
Quote of the Month
"Be fearful when others are greedy and greedy when others are fearful." Warren Buffett
References
The Magnificent 7 chart. https://x.com/charliebilello/status/1957535134632276425
Yardeni Research. (2025). Put/Call & Vix [Dataset]. https://yardeni.com/charts/put-call-vix/
Kwanti Portfolio Analytics
TradingView
I am pleased to announce that my book has been published on Amazon and Spotify (links below).
Timeless on Spotify (audiobook)
The book is available in hardcover, paperback, and Kindle eBook formats. There is also an audiobook version available on Spotify.

Readers interested in how I work one-on-one with clients can visit my website here - Genesis Wealth Planning. You can also reach me via email at paul@genwp.com or Click Here to schedule a 30-minute Introductory Call.
DISCLOSURES & INDEX DESCRIPTIONS
For disclosures and index definitions, please click here.
Unless otherwise specifically cited, opinions expressed herein are solely those of Genesis Wealth Planning, LLC. The material presented is believed to be from reliable sources, and our firm makes no representations regarding other parties’ informational accuracy or completeness. Written content is for information purposes only. Past performance is no guarantee of future results. Diversification does not assure profit or protect against a loss in a declining market. While we have gathered this information from sources believed to be reliable, we cannot guarantee the accuracy of the information provided. The views, opinions, and forecasts expressed in this commentary are as of the date indicated, are subject to change at any time, are not a guarantee of future results, do not represent or offer any particular security, strategy, or investment, and should not be considered investment advice. Investors should consider the investment objectives, risks, and expenses of a mutual fund or exchange-traded fund before investing. Furthermore, the investor should independently assess the legal, regulatory, tax, credit, and accounting and determine with their professional advisers if any of the investments mentioned herein suit their personal goals. All indexes are unmanaged, and an individual cannot invest directly in an index. Index returns do not reflect fees or expenses. Please contact us to receive a copy of Genesis Wealth Planning ADV Part II, which contains additional disclosures, proxy voting policies, and privacy policy. Certified Financial Planner Board of Standards Inc. owns the certification marks CFP®, CERTIFIED FINANCIAL PLANNER™ and federally registered in the U.S., which it awards to individuals who successfully complete CFP Board's initial and ongoing certification requirements.